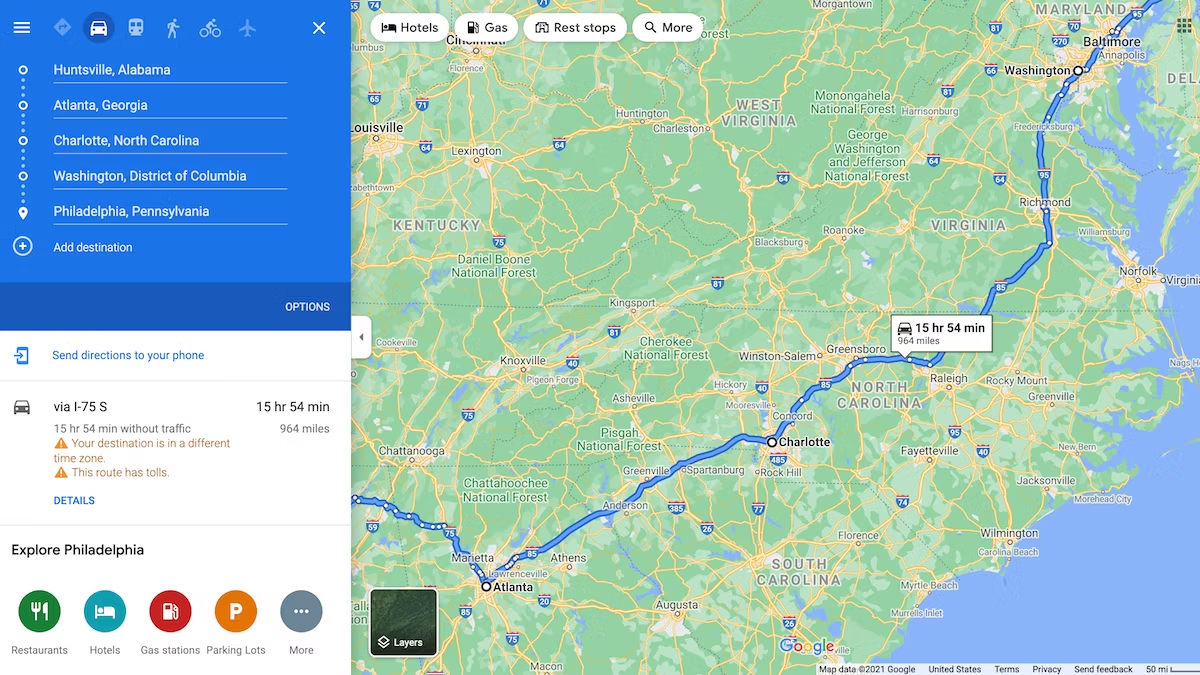
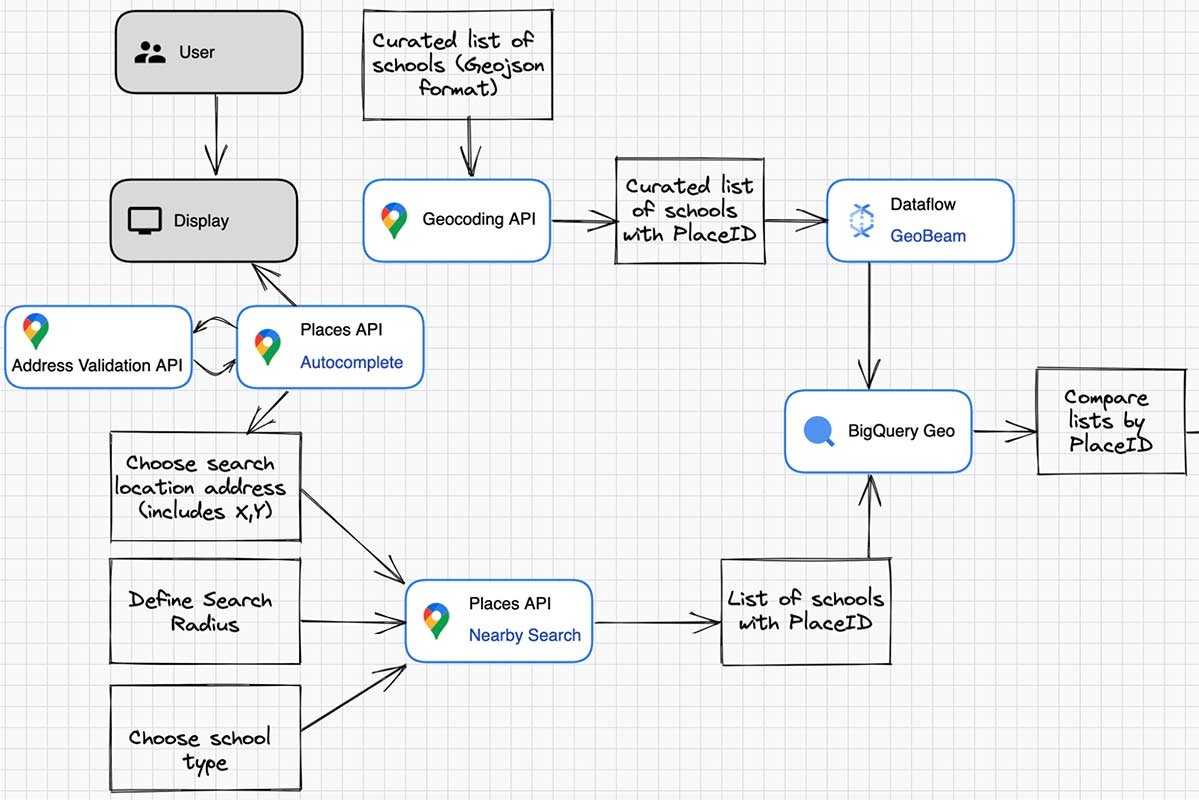
Google Maps Insights provides a powerful platform for analyzing spatial data trends. Allowing businesses and researchers to harness vast amounts of geographic information. By integrating spatial data with Google Maps, users can visualize patterns and trends that would be difficult to discern from raw data alone. This tool can be use to analyze various aspects such as traffic patterns, population density, and the distribution of services or amenities.

Visualizing Spatial Patterns
One of the key advantages of using Google Maps for spatial data analysis is its ability to visualize complex data in an intuitive format. Heat maps, color-coded overlays, and customizable markers help highlight significant trends and anomalies. For instance, businesses can use these visualizations to identify high-traffic areas for opening new stores or services, while urban planners can use them to pinpoint areas in need of infrastructure improvements.
Monitoring Real-Time Changes
Google Maps Insights allows users to monitor real-time changes in spatial data, which is crucial for dynamic environments. Real-time traffic updates, weather conditions, and foot traffic data can be integrated into the analysis, providing a current snapshot of spatial trends. This real-time capability enables businesses and decision-makers to react swiftly to changing conditions, such as adjusting delivery routes based on traffic congestion or deploying resources to areas affected by severe weather.
Optimizing Business Operations
For businesses, analyzing spatial data trends with Google Maps Insights can lead to more efficient operations and better decision-making. By understanding customer distribution and behavior patterns, companies can optimize their supply chain, reduce delivery times, and enhance customer service. Retailers can analyze foot traffic patterns to determine the best locations for new stores or to design effective marketing campaigns targeting high-traffic areas.
Enhancing Urban Planning and Development
Urban planners and government agencies can leverage Google Maps Insights to enhance city planning and development projects. By analyzing spatial data trends, planners can identify areas with high population growth, monitor the effectiveness of public transportation systems, and plan for future infrastructure needs. This data-driven approach leads to more informed decisions, ensuring that resources are allocated efficiently and effectively.
Improving Disaster Response and Management
Google Maps Insights is also invaluable in disaster response and management. By analyzing spatial data relating to natural disasters. Also, emergency services can identify affected areas, plan evacuation routes, and allocate resources where they are needed most. Real-time data on weather conditions and traffic can further enhance the responsiveness and effectiveness of disaster management efforts.
Integrating with Other Data Sources
Google Maps Insights can integrate with other data sources to provide a more comprehensive analysis. Combining geographic data with demographic, economic, or environmental data can yield deeper insights and more accurate predictions. For example, combining traffic data with economic indicators can help businesses forecast sales trends and plan inventory accordingly.
Conclusion
Analyzing spatial data trends with Google Maps Insights offers a robust tool for visualizing, understanding, and acting on geographic information. Whether for optimizing business operations, enhancing urban planning, improving disaster response. Integrating diverse data sources, Google Maps Insights provides valuable capabilities to harness the power of spatial data. This powerful platform enables businesses and researchers to make data-driven decisions that lead to more efficient, effective, and impactful outcomes.


