Chart.js: A Simple and Flexible Charting Library
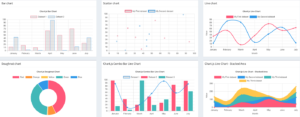
Chart.js is a popular library for creating simple yet flexible charts. It supports various chart types and is easy to set up and use.
Step 1: Include Chart.js in Your Project
- Via CDNAdd the following script tag to your HTML file to include Chart.js:
html
<script src="https://cdn.jsdelivr.net/npm/chart.js"></script>
- Via NPMIf you’re using a build tool like Webpack or npm, install Chart.js using:
bash
npm install chart.js
Then, import it into your JavaScript file:
javascript
import Chart from 'chart.js';
Step 2: Create a Basic Chart
- HTML StructureAdd a
<canvas>element to your HTML where the chart will be rendered:html
<canvas id="myChart" width="400" height="200"></canvas>
- JavaScript for Chart.jsUse the following code to create a basic bar chart:
javascript
const ctx = document.getElementById('myChart').getContext('2d');

const myChart = new Chart(ctx, {

type: 'bar', // Chart type

data: {

labels: ['Red', 'Blue', 'Yellow', 'Green', 'Purple', 'Orange'],

datasets: [{

label: '# of Votes',

data: [12, 19, 3, 5, 2, 3],

backgroundColor: [

'rgba(255, 99, 132, 0.2)',

'rgba(54, 162, 235, 0.2)',

'rgba(255, 206, 86, 0.2)',

'rgba(75, 192, 192, 0.2)',

'rgba(153, 102, 255, 0.2)',

'rgba(255, 159, 64, 0.2)'

],

borderColor: [

'rgba(255, 99, 132, 1)',

'rgba(54, 162, 235, 1)',

'rgba(255, 206, 86, 1)',

'rgba(75, 192, 192, 1)',

'rgba(153, 102, 255, 1)',

'rgba(255, 159, 64, 1)'

],

borderWidth: 1

}]

},

options: {

scales: {

y: {

beginAtZero: true

}

}

}

});
- Customizing the ChartYou can customize the appearance and behavior of your chart by modifying the
dataandoptionsproperties. Check the Chart.js documentation for more details on customization.
D3.js: A Powerful Library for Complex Visualizations
D3.js (Data-Driven Documents) is a powerful library for creating complex and interactive data visualizations. It provides fine-grained control over the final output and is suitable for advanced charting needs.
Step 1: Include D3.js in Your Project
- Via CDNAdd the following script tag to your HTML file:
html
<script src="https://d3js.org/d3.v7.min.js"></script>
- Via NPMIf you’re using npm, install D3.js:
bash
npm install d3
Then, import it into your JavaScript file:
javascript
import * as d3 from 'd3';
Step 2: Create a Basic Bar Chart
- HTML StructureAdd an SVG element to your HTML where the chart will be rendered:
html
<svg width="500" height="300"></svg>
- JavaScript for D3.jsUse the following code to create a basic bar chart:
javascript
const data = [30, 86, 168, 281, 303, 365];const svg = d3.select(‘svg’);
const width = +svg.attr(‘width’);
const height = +svg.attr(‘height’);
const barWidth = width / data.length;svg.selectAll(‘rect’)
.data(data)
.enter()
.append(‘rect’)
.attr(‘x’, (d, i) => i * barWidth)
.attr(‘y’, d => height – d)
.attr(‘width’, barWidth – 1)
.attr(‘height’, d => d)
.attr(‘fill’, ‘steelblue’); - Customizing the ChartD3.js allows for extensive customization and interaction. You can add axes, tooltips, transitions, and much more. For advanced features, refer to the D3.js documentation.
Comparing Chart.js and D3.js
- Chart.js is ideal for straightforward use cases where you need a quick and easy way to generate standard charts. It’s user-friendly and great for most common chart types.
- D3.js is best suited for more complex visualizations where you need detailed control over the rendering and interactions. It’s highly customizable but requires more setup and a deeper understanding of data visualization principles.
Conclusion
Both Chart.js and D3.js are powerful tools for data visualization, each with its strengths. Chart.js offers simplicity and ease of use for standard charts, while D3.js provides the flexibility and control needed for complex and interactive visualizations. By choosing the right library based on your needs, you can create engaging and informative charts for your web appli


